Anomaly detection at the Dutch alliance on income data and taxes
The Dutch alliance on income data and taxes puts substantial effort into the analysis of data quality. As part of a research initiative in 2017 and 2018 several innovative products regarding anomaly detection have been developed. Anomalies are cases in a dataset that do not seem to conform to the normal pattern and for that reason may be of interest. The results of the conducted research are relevant for both practice and academia.
A proper analysis of the quality of the income (payroll) data is crucial. Many stakeholders use this data, amongst others for making decisions that affect both civilians and organizations. The importance of data quality can be expected to grow in the years to come, in part because many organizational processes will show higher degrees of automation.
For this reason the quality of the income data has drawn considerable attention. Many of these analyses are highly rule-driven, because laws and regulations regarding work and taxes offer a strong base for creating verification rules. However, it is also possible to use advanced analytics to approach the data quality issue in a totally different and strongly data-driven way. A clever algorithm can autonomously conduct an analysis of the dataset and detect patterns and deviations from these patterns. Such an approach might lead to surprising results for data stewards, since the algorithm will analyze the data in its own way and without strict and predefined rules. This allows for a serendipitous analysis and gaining unexpected insights.
This is the essence of (unsupervised) anomaly detection, i.e. looking for strange and remarkable cases in a dataset. The detected anomalies are not necessarily erroneous or suspicious. They are deviations from the regular patterns. Such a data analysis can therefore help to obtain more knowledge of your dataset. Moreover, some of these anomalies will prove to be actual errors, indicative of real problems. Indeed, several of the deviations that were detected by the employed algorithm represented quality problems in the income data. As a result the software has now been improved in order to prevent these errors in the future. This will be explained in more detail below.
Typology of anomalies
One of the delivered results is the typology of anomalies. This conceptual framework offers a fundamental understanding of the different deviations that one can encounter in datasets. The typology is inspired by the processes of the alliance on income data and taxes, but, as a general-purpose tool, can be applied to all datasets.
In statistics and data science, anomalies are cases that are in some way awkward and do not appear to be part of the general patterns present in the dataset. Such cases are often also referred to as outliers, novelties or deviant observations. Anomalies may be of interest, as these cases may point to erroneous data entry, a malfunctioning process, fraud or crucial breaks in real world trends.
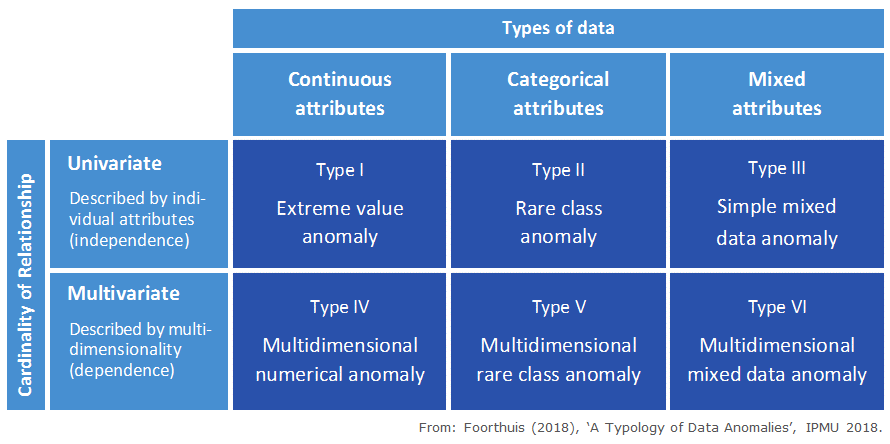
The typology defines six base types of anomalies. It provides a theoretical and tangible understanding of the anomaly types a data analyst may encounter. It also assists researchers with evaluating which types of anomalies can be detected by a given anomaly detection (AD) algorithm. Finally, as a framework it aids in analyzing, amongst others, the conceptual levels of data and anomalies.
The typology differentiates between the set’s ‘awkward cases’ by means of two very fundamental data-related dimensions:
- The types of data: The data types of the attributes (i.e. variables) that are involved in the anomalous character of a deviant case. These attributes thus have to be handled appropriately during the analysis in order for the anomaly to be detected. The data types can be continuous (numeric, such as the attribute Height), categorical (code-based, such as City) or mixed (when you have both Height and City in your dataset).
- The cardinality of relationship: How the various attributes relate to each other when describing anomalous behavior. These attributes are responsible for the deviant nature of the case. This can be univariate, which means the attributes are separately (individually) responsible for the deviant behavior, so the analysis can assume independence between the variables. The cardinality can also be multivariate, which means that the deviant behavior of the anomaly lies in the relationships between its variables, so these variables have to be analyzed jointly.

The different types of anomalies are:
- Type I - Extreme value anomaly: A case with an extremely high, low or otherwise rare value for one or multiple individual numerical attributes. A case can be an anomaly with respect to one individual variable, so Type I anomalies do not depend on relationships between attributes. Such a case has one or more values that can be considered extreme or rare when the entire dataset is taken into account. Traditional univariate statistics typically considers this type of outlier, e.g. by using a measure of central tendency plus or minus 3 times the standard deviation or the median absolute deviation.
- Type II - Rare class anomaly: A case with an uncommon class value for one or multiple categorical variables. A case can be an anomaly with respect to one individual attribute, so Type II anomalies do not depend on relationships between attributes.
- Type III - Simple mixed data anomaly: A case that is both a Type I and Type II anomaly, i.e. with at least one extreme value and one rare class. This anomaly type deviates with regard to multiple data types. This requires deviant values for at least two attributes, each anomalous in its own right. These can thus be analyzed separately; analyzing the attributes jointly is not necessary because the case is not anomalous in terms of a combination of values.
- Type IV - Multidimensional numerical anomaly: A case that does not conform to the general patterns when the relationship between multiple continuous attributes is taken into account, but which does not have extreme values for any of the individual attributes that partake in this relationship. The anomalous nature of a case of this type lies in the deviant or rare combination of its continuous attribute values, and as such hides in multidimensionality. It therefore requires several continuous attributes to be analyzed jointly to detect this type.
- Type V - Multidimensional rare class anomaly: A case with a rare combination of class values. In datasets with independent data points a minimum of two substantive categorical attributes needs to be analyzed jointly to discover a multidimensional rare class anomaly. An example is this curious combination of values from three attributes used to describe dogs: ‘MALE’, ‘PUPPY’ and ‘PREGNANT’.
- Type VI - Multidimensional mixed data anomaly: A case with a deviant relationship between its continuous and categorical attributes. The anomalous case generally has a categorical value or a combination of categorical values that in itself is not rare in the dataset as a whole, but is only rare in its neighborhood (numerical area) or local pattern. As with Type IV and V anomalies, such cases hide in multidimensionality and multiple attributes need thus to be jointly taken into account to identify them. In fact, multiple datatypes need to be used, as a Type VI anomaly per definition requires both numerical and categorical data.
The value of this typology lies not only in providing both a theoretical and tangible understanding of the types of anomalies, but also in its ability to evaluate which type of anomalies can be detected by a given algorithm. Interestingly, most academic research publications do not make it very clear which type of anomaly can be detected. Research has often focused mainly on studying the performance of technical aspects such as speed, dataset size and number of attributes, and seems to have largely neglected the functional aspects of AD. However, it is a good practice to provide tangible insight into to the functional capabilities of an anomaly detection algorithm.
Examples
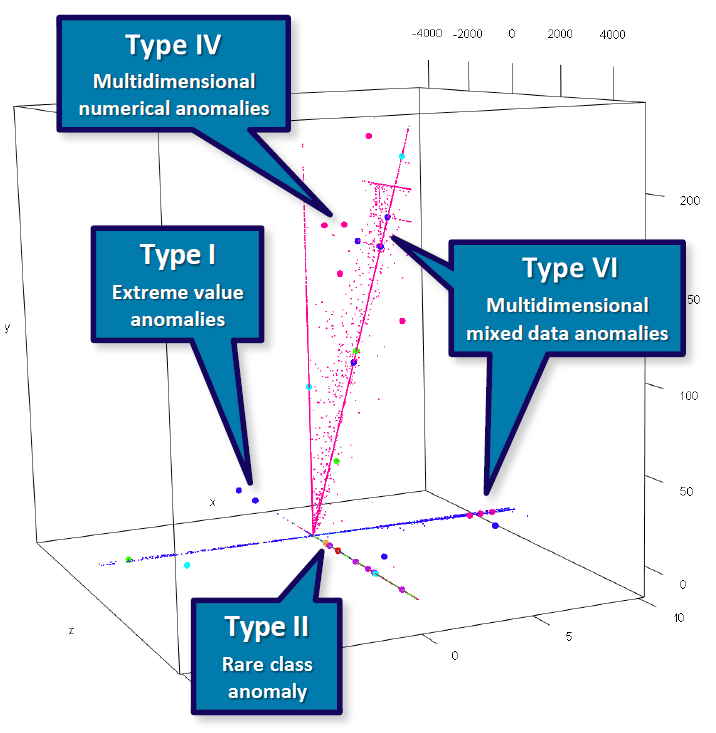
The following diagram illustrates the types of anomalies described above. The plot below features three numerical variables (represented as the cube) and one categorical attribute (represented as a color). This 4D diagram is a snapshot of income data from the Polis Administration. The three continuous attributes represent sums of money (e.g. income and sums withheld for social security) while the categorical attribute represents a social security code. Large dots (basically the 5th dimension in the plot) represent anomalies automatically detected by an unsupervised AD algorithm, SECODA (see below). This not only shows that different types of anomalies can be detected by such an algorithm, but also that they can indeed be encountered in practice.

The two Type I examples are extreme value anomalies because they have a very low value for the continuous variable z. The Type II example is one of the few orange cases in the set and is therefore a rare class anomaly. The Type IV examples deviate from the general multivariate pattern that can be observed for continuous attributes, making them multidimensional numerical anomalies. The Type VI examples have a color rarely seen in their respective neighborhood, which makes them multidimensional mixed data anomalies. Type VI cases can also take the form of second- or higher-order anomalies, with categorical values that are not rare (not even in their neighborhood), but are rare in their combination in that specific area (see Foorthuis 2017 for an example). The diagram does not show Type III and V anomalies. However, the rare class anomaly would have been a Type III anomaly if it had been positioned to, e.g., the extreme left. Also, if orange would be a normal color in this dataset, but orange in combination with an additional categorical variable would make for an uncommon value pair, it would be a Type V anomaly. See Foorthuis (2018) for more visual examples of the different types of anomalies.
In the scientific article more information about the typology can be found, including more examples and a discussion on the difference between sets with dependent and independent data.
The SECODA algorithm for anomaly detection
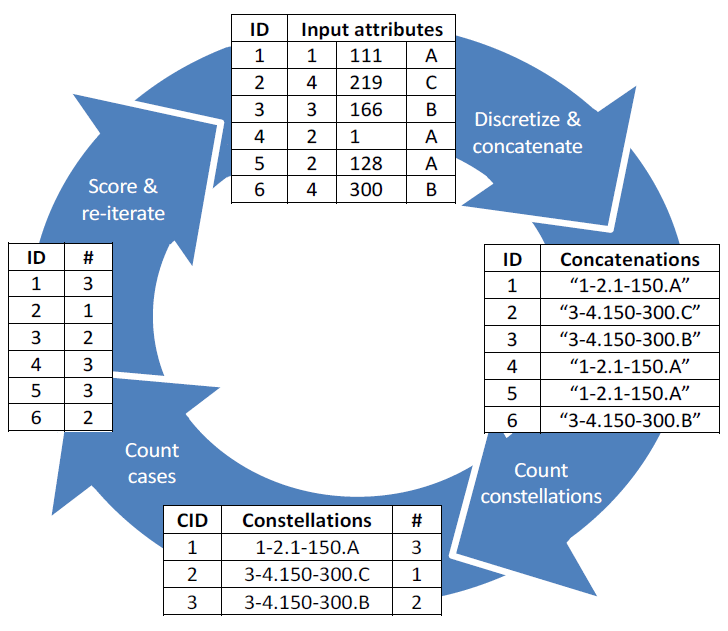
As part of the research the new SECODA algorithm for anomaly detection was developed, which was used in several experiments. The algorithm is capable of detecting all six anomaly types. SECODA analyzes the data in several process steps, each of which performs a number of transformations and calculations.

SECODA stands for Segmentation- and Combination- Based Detection of Anomalies. It is a general-purpose unsupervised non-parametric anomaly detection algorithm for datasets containing continuous and/or categorical attributes. The method, in its standard mode, is guaranteed to identify cases with unique or rare combinations of attribute values. SECODA uses the histogram-based approach to assess the density. The ‘concatenation trick’ - which combines discretized continuous attributes and categorical attributes into a new variable - is used to determine the joint density distribution. In combination with recursive discretization this captures complex relationships between attributes and avoids discretization error. A pruning heuristic as well as exponentially increasing weights and arity are employed to speed up the analysis. See the references below for more information.
Some characteristics of SECODA:
- It is a simple algorithm without the need for point-to-point calculations. Only basic data operations are used, making SECODA suitable for sets with large numbers of rows as well as for in-database analytics.
- SECODA is able to deal with all kinds of relationships between attributes, such as statistical associations, interactions, collinearity and relations between variables of different data types.
- The pruning heuristic, although simple by design, is a self-regulating mechanism during runtime, dynamically deciding how many cases to discard.
- The exponentially increasing weights both speed up the analysis and prevent bias.
- The algorithm has low memory requirements and scales linearly with dataset size.
- For extremely large sets a longer computation time is hardly required because additional iterations would not yield a meaningful gain in precision.
- Missing values are automatically handled as one would functionally desire in an AD context, with only very rare missing values being considered anomalous.
- The algorithm can be easily implemented for parallel processing architectures.
- In addition, the real-world data quality use case and the simulations not only show that all types of anomalies can be detected by SECODA, but also that they can be encountered in practice.
De conducted experiments indicate that SECODA, and anomaly detection in general, can contribute to data quality in a very practical manner. An analysis of a sample of income data from the Polis Administration yielded several interesting insights. The anomalies identified by SECODA, for example, often corresponded with candidate verification rules that had been formulated before by the data analysts who evaluate the data quality on a regular basis. SECODA, apparently, is able to detect interesting and remarkable cases. A closer inspection brought to light that, similar to application of the candidate verification rules, most anomalies could not be proven to be undisputed errors. However, one group of anomalies detected by SECODA did turn out to represent a real quality issue. This was not an error in the received and stored income data in the Polis Administration. The source of the quality issue proved to be the fact that the export from the Polis was less complete than possible. From a technical point of view this data retrieval was correct. However, because the relevant entities have their own timelines (and rightfully so), they not always fit seamlessly. In such a situation it is technically logical to insert null values in some cells when selecting, integrating and delivering data. However, from a semantic perspective we know that some of those values are actually known in the Polis Administration. It was therefore decided to change the selection and delivery software in such a way as to fill those cells with the correct values. The delivered data is consequently filled better and richer than before.
More information about SECODA can be found in the scientific article .The algorithm can be downloaded as a free open source implementation for the R environment for data analysis, as well as several examples and datasets. See ‘SECODA resources for R’ on this page.
Summary
A summary of this article in Dutch can be found here.
Publications
The typology and the algorithm are not only relevant for practice – such as data quality analyses or fraud or error detection – but are also interesting from an academic perspective. The papers in which the typology and the algorithm are presented have been accepted at important scientific conferences on data science and analytics. The following publications can be downloaded: the SECODA algorithm, identifying different types of anomalies using available algorithm settings, and the typology of anomalies.
About the author
Dr. Ralph Foorthuis is lead architect at UWV Data Services. As a practitioner he focuses on the Polis Administration and other data registers, the datawarehouse, advanced analytics, process and system integration, web portals, data quality, security, information policy and systems development. He holds a PhD in Information Systems from Utrecht University. His academic research focuses on architecture, compliance and statistical methods for unsupervised anomaly detection. See www.foorthuis.nl for an overview of his publications.
References
Foorthuis, R.M. (2018). The Impact of Discretization Method on the Detection of Six Types of Anomalies in Datasets. Proceedings of the 30th Benelux Conference on Artificial Intelligence (BNAIC 2018), November 8-9 2018, Den Bosch, the Netherlands.
Foorthuis, R.M. (2018). A Typology of Data Anomalies. Accepted for Presentation at IPMU 2018, the 17th International Conference on Information Processing and Management of Uncertainty in Knowledge-Based Systems, Cádiz, Spain. DOI10.1007/978-3-319-91476-3_3
Foorthuis, R.M. (2017). SECODA: Segmentation- and Combination-Based Detection of Anomalies. In: Proceedings of the 4th IEEE International Conference on Data Science and Advanced Analytics (DSAA 2017), Tokyo, Japan, pp. 755-764. DOI: 10.1109/DSAA.2017.35
Foorthuis, R.M. (2017). Anomaly Detection with SECODA. Poster Presentation at the 4th IEEE International Conference on Data Science and Advanced Analytics (DSAA 2017), Tokyo, Japan. DOI: 10.13140/RG.2.2.21212.08325